The Profit and Loss Report (P&L): How to Build It, Read It and What It Tells You About Your Business
Finance5 min read
The profit and loss report in simple terms: P&L structure, a company example, how it differs from revenue and cash flow, and how to get it without Excel.

The profit and loss report is a business owner's main management report.
Revenue shows how much you sold. The P&L shows how much of it the company kept.
One-minute calculation
- Revenue for the month.
- Minus cost of sales — gross profit.
- Minus operating expenses — operating profit.
- Minus taxes and interest — net profit.
- Compare with last month and the same month last year.
P&L structure
| Line | What it shows |
|---|---|
| Revenue | All sales for the period |
| − Cost of sales | Materials, purchases, delivery, direct pay for executors |
| = Gross profit | What's left after direct costs |
| − Operating expenses | Rent, salaries, advertising, services |
| = Operating profit | The result of core activities |
| − Taxes and interest | Mandatory payments |
| = Net profit | The bottom line for the owner |
Example P&L for a month
| Item | Amount |
|---|---|
| Revenue | 2,000,000 ₽ |
| Cost of sales | 900,000 ₽ |
| Gross profit | 1,100,000 ₽ |
| Salaries | 450,000 ₽ |
| Advertising | 200,000 ₽ |
| Rent and services | 150,000 ₽ |
| Operating profit | 300,000 ₽ |
| Taxes | 60,000 ₽ |
| Net profit | 240,000 ₽ |
With revenue of 2 million, the company earned 240 thousand — 12%. Without a P&L, the owner might have thought all was well because "there are lots of sales".
The P&L and the statutory "Form 2"
In Russian accounting, the statement of financial results is often called "Form 2" — a mandatory annual form for the tax authority. The management P&L shown above is more convenient: you can produce it every month and break it down by product, channel and employee.
How to read a P&L
- Gross margin is falling — cost of sales has grown: suppliers, delivery, discounts.
- Operating expenses grow faster than revenue — the team or advertising is getting more expensive faster than sales.
- Net profit fluctuates — compare with last year: it may be seasonality.
The P&L and cash flow are not the same
The P&L shows profit at the point of sale, even if the client hasn't paid yet. The cash flow statement shows real money movement. That's why there can be profit but no money in the account. More in our article profit on paper, no cash.

What a P&L looks like in different businesses
| Line | Clinic | Real estate agency | Online store |
|---|---|---|---|
| Revenue | 3,000,000 ₽ | 2,400,000 ₽ | 5,000,000 ₽ |
| Cost of sales | 1,200,000 ₽ (doctors, materials) | 1,200,000 ₽ (agents' shares) | 3,500,000 ₽ (purchasing, logistics) |
| Gross profit | 1,800,000 ₽ | 1,200,000 ₽ | 1,500,000 ₽ |
| Operating expenses | 1,300,000 ₽ | 850,000 ₽ | 1,150,000 ₽ |
| Operating profit | 500,000 ₽ | 350,000 ₽ | 350,000 ₽ |
The online store has the highest revenue, but the same operating profit as an agency with half the turnover. The report immediately shows where a business earns through "expensive" revenue.
5 questions the report answers
- Is profit growing along with revenue? If not, see why revenue grows but profit doesn't.
- What share of revenue goes on cost of sales? A rising share is a signal to review prices or suppliers.
- Are team costs growing faster than sales?
- Does advertising pay off? Compare the growth in marketing spend with revenue growth.
- How much can the owner take out? See how much money to take out of a business.
Common mistakes in the report
- Recording a client's prepayment as the month's revenue although the service hasn't been delivered yet.
- Expensing equipment purchases in full instead of spreading them over their useful life.
- Mixing the owner's personal expenses with company expenses.
- Not accounting for the owner's pay if they work in the company.
The accounting counterpart of the P&L is the statement of financial results, which companies file with the tax authority as part of their annual reporting on Ministry of Finance forms. A management P&L follows the same logic but is produced monthly, with whatever level of detail suits the owner.
How it works in Mestra
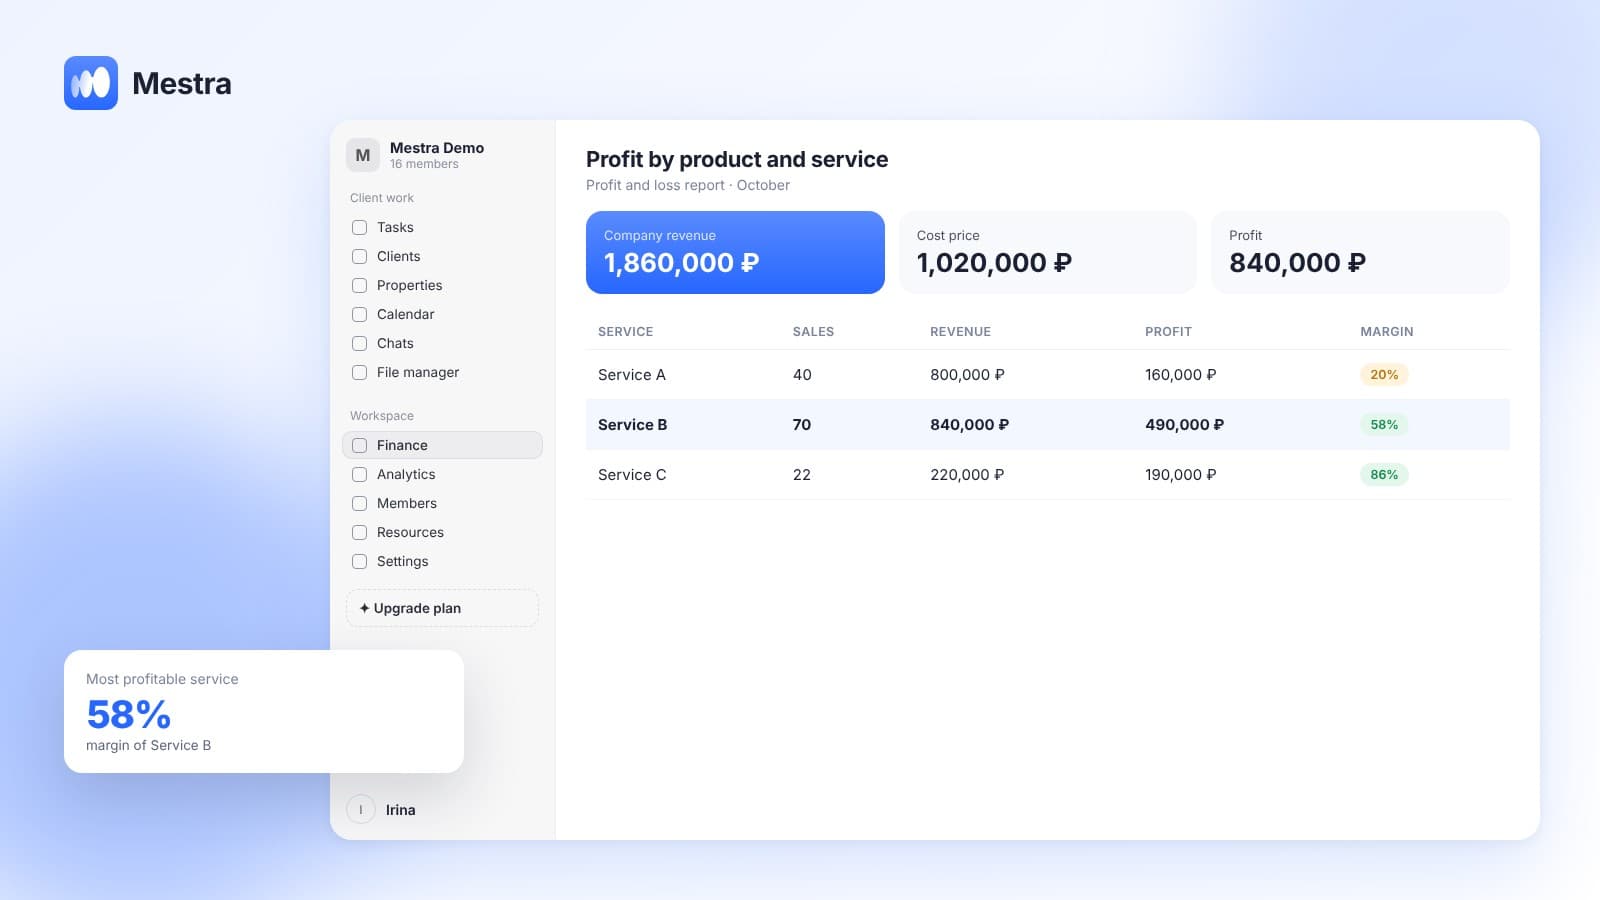
- Profit and loss report and detailed financial reports.
- Expense items in 7 groups: cost of sales, marketing, staff, premises, operations, finance and legal, other.
- Cost of every product from the product card — you can see what the result is made of.
- Employee profile: salary and income, working hours, holidays, workplace; salary is recorded as a monthly expense.
Related reading: multi-currency accounting.
FAQ
How is a management P&L different from the statutory statement of financial results?
The statutory report follows the tax authority's rules. A management P&L follows rules convenient for the owner, and is produced more often: every month.
How often should a P&L be produced?
Monthly. For quick decisions, it's useful to look at interim figures weekly.
Can you keep a P&L without an accountant?
Yes, if income and expenses are recorded in one system. In Mestra, the report is assembled automatically.
Bottom line
A P&L turns revenue into a clear answer: is the business making money or not, and where is it losing it.
Review it every month. In Mestra, the profit and loss report is available in the same system where you manage clients — without exports or spreadsheets.