Revenue forecast: how to understand how much money will come in over the next month
Finance7 min read
A revenue forecast in plain words: what it consists of, how to calculate it from issued invoices and pipeline deals, stage probabilities, an example, mistakes.

A revenue forecast is a calculation of how much money a company will most likely receive over the next month or quarter, based on issued invoices and the deals currently in progress. It helps you see a dip or growth in advance and make decisions in time.
In this article: What the forecast consists of · A calculation example · Take timing into account · How to use the calculation · How to make the forecast more accurate · How to calculate your own stage probabilities · Forecast scenarios · Common mistakes · Case study: a weighted pipeline forecast and an accuracy check · How to check that the forecast is accurate · 30-day plan
A forecast in a minute
| Part | How to calculate |
|---|---|
| Pending invoices | Invoice total × the share clients usually pay |
| Pipeline deals | Deal amount × stage probability |
| Repeat clients | Average revenue from regular clients for the period |
| Total | The sum of the three parts |
What the forecast consists of
1. Issued but unpaid invoices
The most reliable part. But even here it is not 100%: some clients pay late, some don't pay. Look at what share of invoices clients pay within a month — for example, 90%.
2. Pipeline deals
Deals at different stages close with different probability.
| Stage | Probability (example) |
|---|---|
| New lead | 10% |
| Consultation | 25% |
| Proposal | 40% |
| Approval | 60% |
| Invoice issued | 90% |
It is best to calculate probabilities from your own history: what share of deals from each stage ends up paid.
3. Repeat purchases
If the company has regular clients, their recurring payments can be estimated from past months.
A calculation example
| Part | Amount | Probability | Into the forecast |
|---|---|---|---|
| Pending invoices | 1,200,000 ₽ | 90% | 1,080,000 ₽ |
| Deals at the "Approval" stage | 900,000 ₽ | 60% | 540,000 ₽ |
| Deals at the "Proposal" stage | 1,500,000 ₽ | 40% | 600,000 ₽ |
| New leads | 2,000,000 ₽ | 10% | 200,000 ₽ |
| Repeat clients | — | — | 300,000 ₽ |
| Total | 2,720,000 ₽ |
Take timing into account
A deal at the "Proposal" stage in a long B2B cycle won't bring money this month, even if it closes. For accuracy, take into account the average time to payment at each stage. More in the article on time in a deal stage.
How to use the calculation
| The calculation shows | Decision |
|---|---|
| A dip in a month | Step up sales, postpone big expenses |
| Growth above plan | Prepare people and purchasing |
| Most of it is in pending invoices | Strengthen payment control |
| Most of it is in early stages | The estimate is unreliable, build in a buffer |
This kind of calculation is the basis for a payment calendar.
How to make the forecast more accurate
- Honest stages. A deal moves to a stage in fact, not by the rep's feeling.
- Your own probabilities. Recalculate them quarterly from history.
- A clean pipeline. Dead deals are closed with a loss reason.
- Comparison with actuals. At month-end — how closely the forecast matched reality.
- Payment timing. Account for when the money will really arrive.
How to calculate your own stage probabilities
- Take the deals closed over the last 6–12 months — both won and lost.
- For each stage, count how many deals passed through it.
- Count how many of them ended up paid.
- Divide the paid ones by those that passed through — that is the stage probability.
| Stage | Deals passed | Paid | Probability |
|---|---|---|---|
| Consultation | 400 | 88 | 22% |
| Proposal | 210 | 88 | 42% |
| Approval | 130 | 88 | 68% |
| Invoice issued | 97 | 88 | 91% |
If a company's stages are honest, such probabilities change slowly and give a stable calculation.
Forecast scenarios
It is useful to calculate not one figure but three:
| Scenario | How to calculate |
|---|---|
| Conservative | Only invoices and deals at late stages |
| Base | The whole weighted pipeline |
| Optimistic | Base plus large deals with strong signals |
Make decisions about fixed expenses on the conservative scenario, and about preparing for growth on the base one.
Common mistakes
- Counting the entire pipeline as future revenue. The forecast comes out 3–5 times higher than reality.
- Not closing dead deals. The pipeline is inflated.
- Forecasting from reps' words. "He'll definitely buy" is not data.
- Not comparing with actuals. Mistakes repeat.
- Ignoring currencies. Invoices in different currencies are added together without conversion.

Case study: a weighted pipeline forecast and an accuracy check
A hypothetical example: deals at different stages and a closing probability calculated from the company's history.
| Stage | Deals | Average order | Probability | Weighted amount |
|---|---|---|---|---|
| Negotiation | 4 | 200,000 ₽ | 50% | 400,000 ₽ |
| Commercial proposal | 6 | 150,000 ₽ | 30% | 270,000 ₽ |
| Qualification | 10 | 100,000 ₽ | 10% | 100,000 ₽ |
| Total | 20 | 770,000 ₽ |
The pipeline revenue forecast is 770,000 ₽. It is not a guarantee but an expected value: some deals will close, some won't.
How to check that the forecast is accurate
Compare the forecast with the actual result every month:
| Month | Forecast | Actual | Deviation |
|---|---|---|---|
| August | 800,000 ₽ | 720,000 ₽ | −10% |
| September | 750,000 ₽ | 780,000 ₽ | +4% |
| October | 770,000 ₽ | 740,000 ₽ | −4% |
If the deviation is consistently in one direction, adjust the stage probabilities. If it jumps around, check whether all deals are being entered into the system and stages are updated on time.
Remember: a forecast is only as good as its data. Deals without a date, amount or owner distort the result.
30-day plan
| Week | What to do |
|---|---|
| 1 | Define the pipeline stages and the criteria for moving between them |
| 2 | Calculate probabilities from 6–12 months of history |
| 3 | Clean up: amounts, close dates, owners |
| 4 | Build the first forecast and compare it with the actual at month-end |
How it works in Mestra
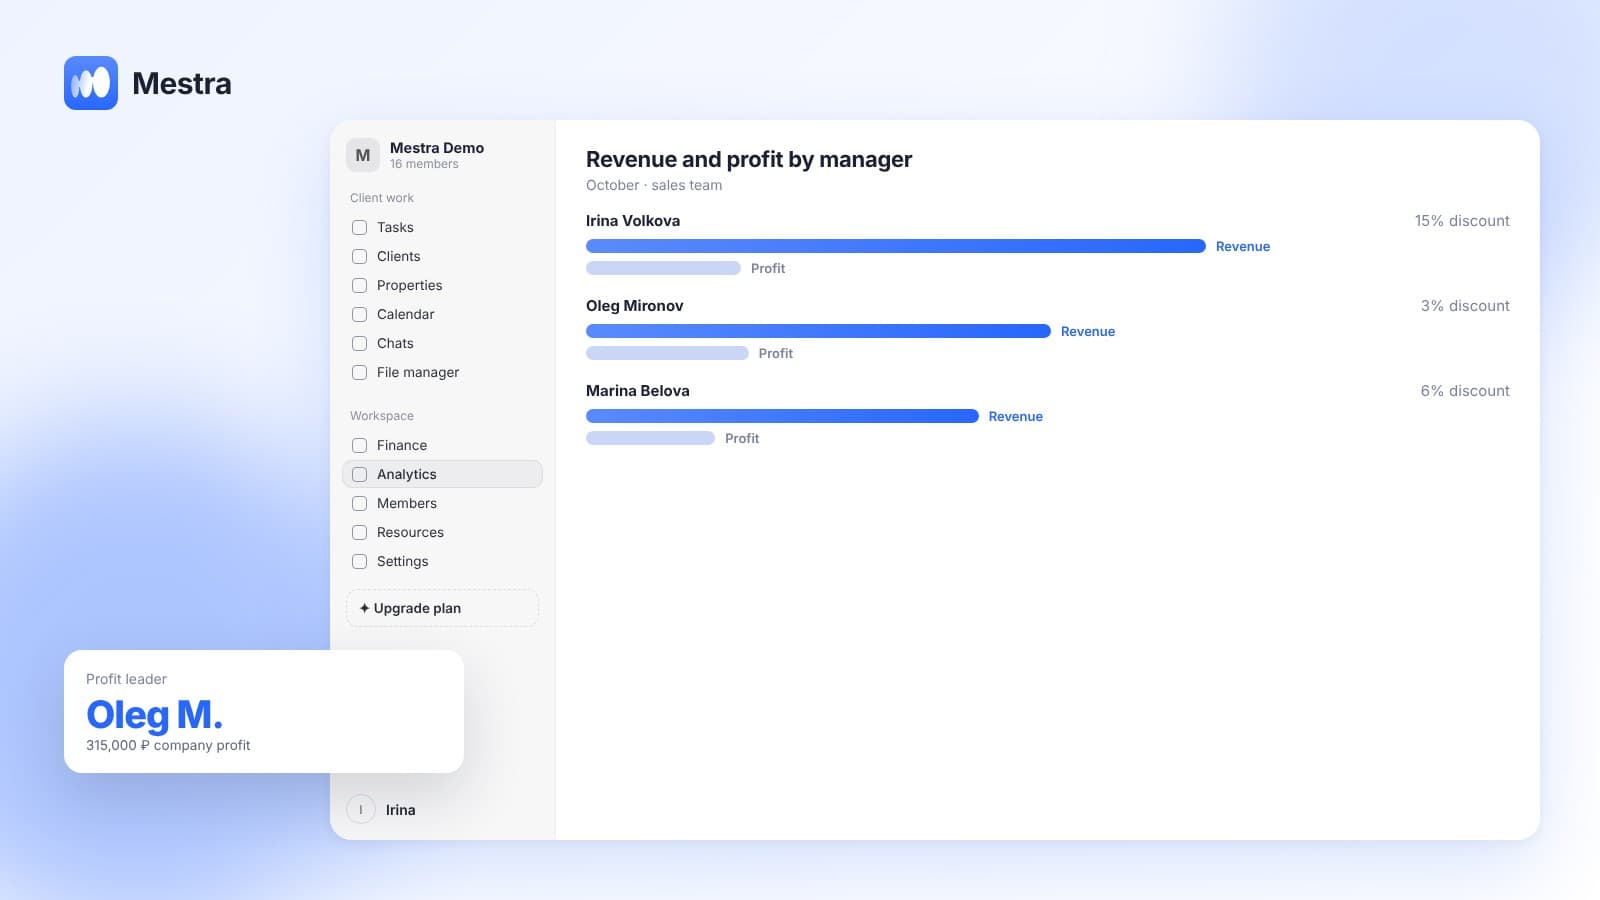
- Revenue forecast in analytics. A separate block shows pending invoices plus the projected pipeline.
- By currency. The forecast and turnover are shown separately in rubles, dollars and euros.
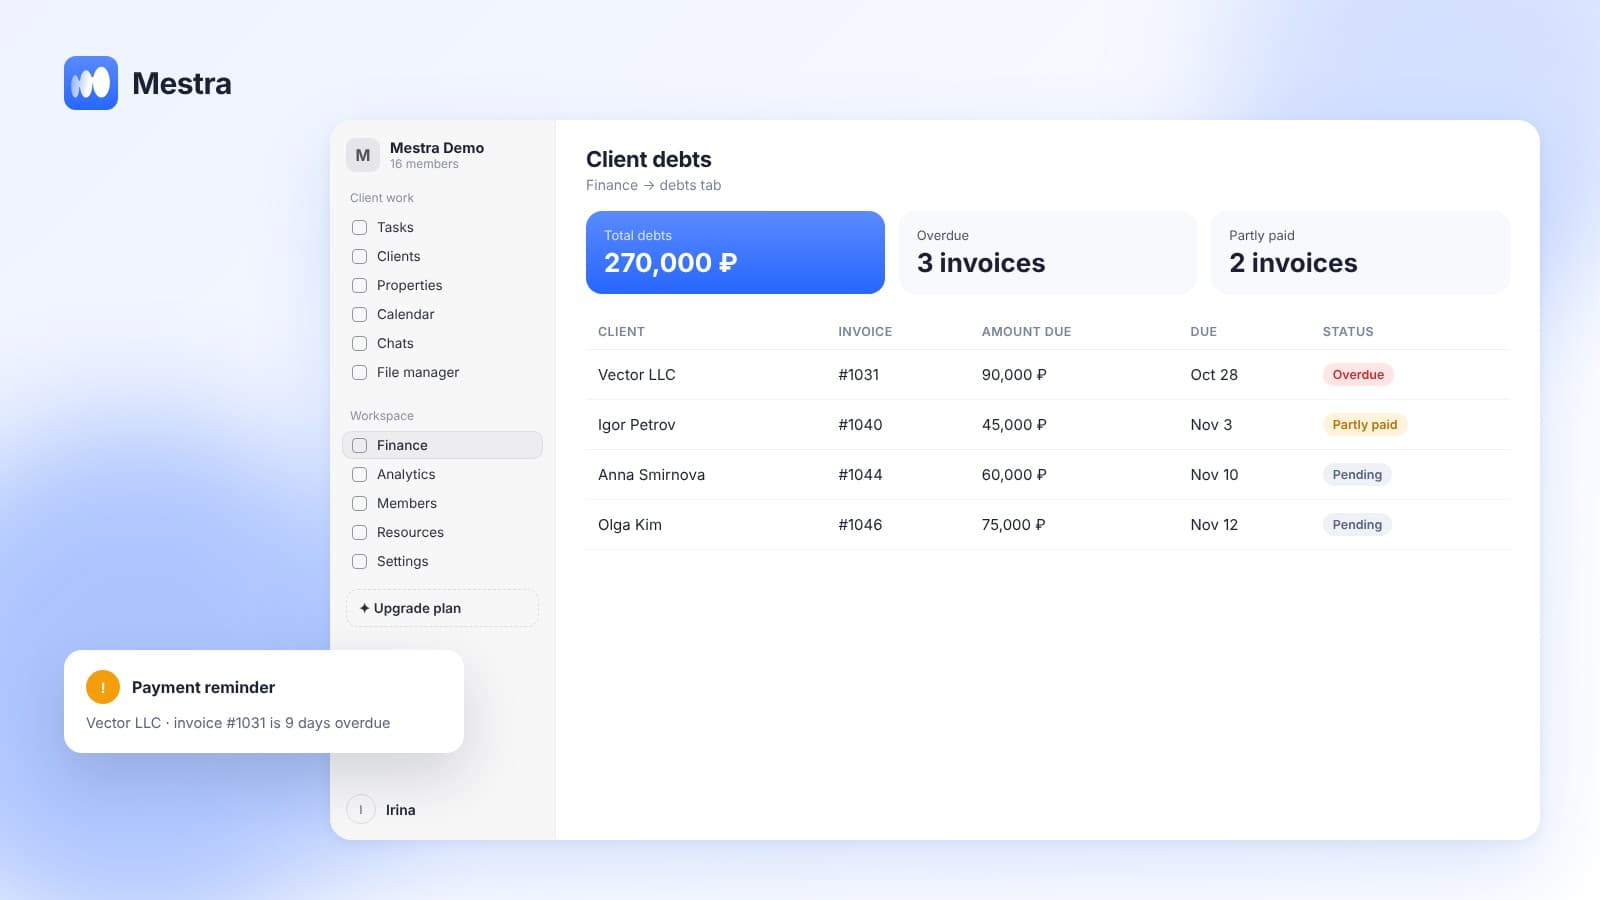
- Invoice payment statuses. An invoice is considered paid based on actual receipts.
- Stages and conversion. Pipeline conversion and won deals are visible.
- Loss reasons. Lost deals are closed with a reason and don't inflate the pipeline.
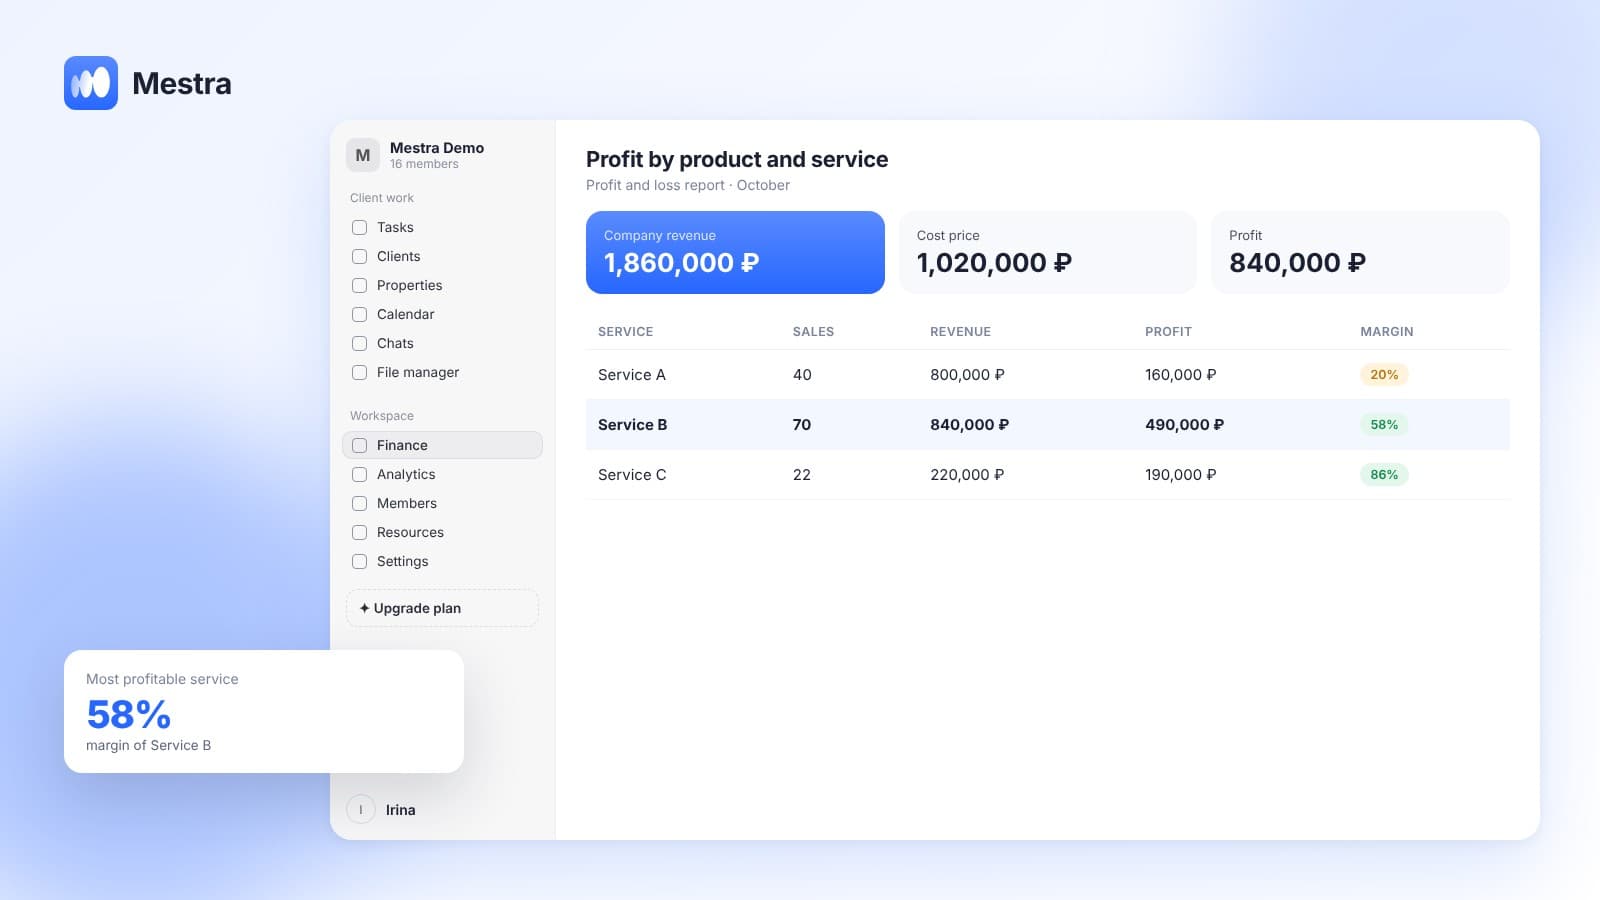
- Profit and loss statement. Actual revenue and expenses to compare with the forecast.
Frequently asked questions
How do you forecast revenue for a month?
Add up pending invoices adjusted for the payment share, pipeline deals weighted by their stage probabilities, and expected repeat purchases.
What is a weighted pipeline?
The sum of deals multiplied by the closing probability for their stage. It is more accurate than the plain sum of all deals.
Where do you get stage probabilities?
From your own history: what share of deals from each stage ended up paid.
Why does the forecast differ so much from the actual result?
Usually because of an inflated pipeline, dishonest stages and unaccounted payment timing.
How often should you update the forecast?
Weekly in day-to-day work, and the stage probabilities once a quarter.
Summary
A revenue forecast is made up of pending invoices, a weighted pipeline and repeat purchases. Accuracy depends on honest stages, your own probabilities and regular comparison with actuals.
In Mestra, the revenue forecast based on pending invoices and the pipeline is visible in analytics in different currencies, and invoices are marked paid based on actual receipts. Try Mestra free for 15 days at mestra.chat.